OEE
Consolidated view of overall equipment effectiveness.

SENNZE Platform
Output, states, operators, products, quality and process variables brought together on a platform built to turn field data into operational information.
Talk to SENNZE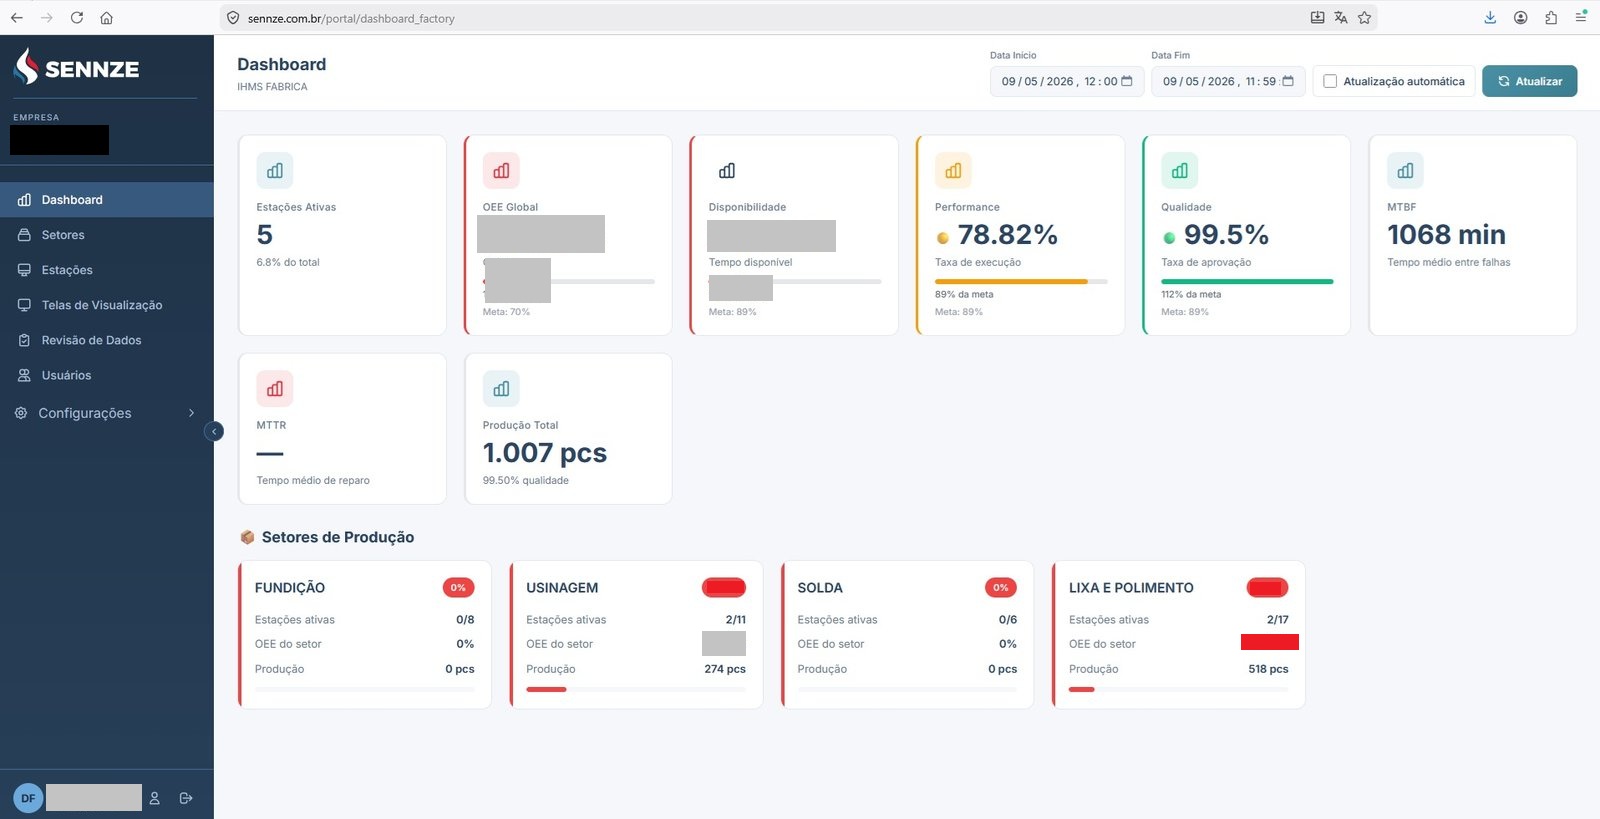
From acquisition to management
The information SENNZE presents starts in the process. Data can be acquired automatically from machines and sensors, or recorded by the operation itself.
Local processing organizes that information and keeps local monitoring available even when there is no external connection. The web platform widens access for supervision, analysis and management.
Operational monitoring
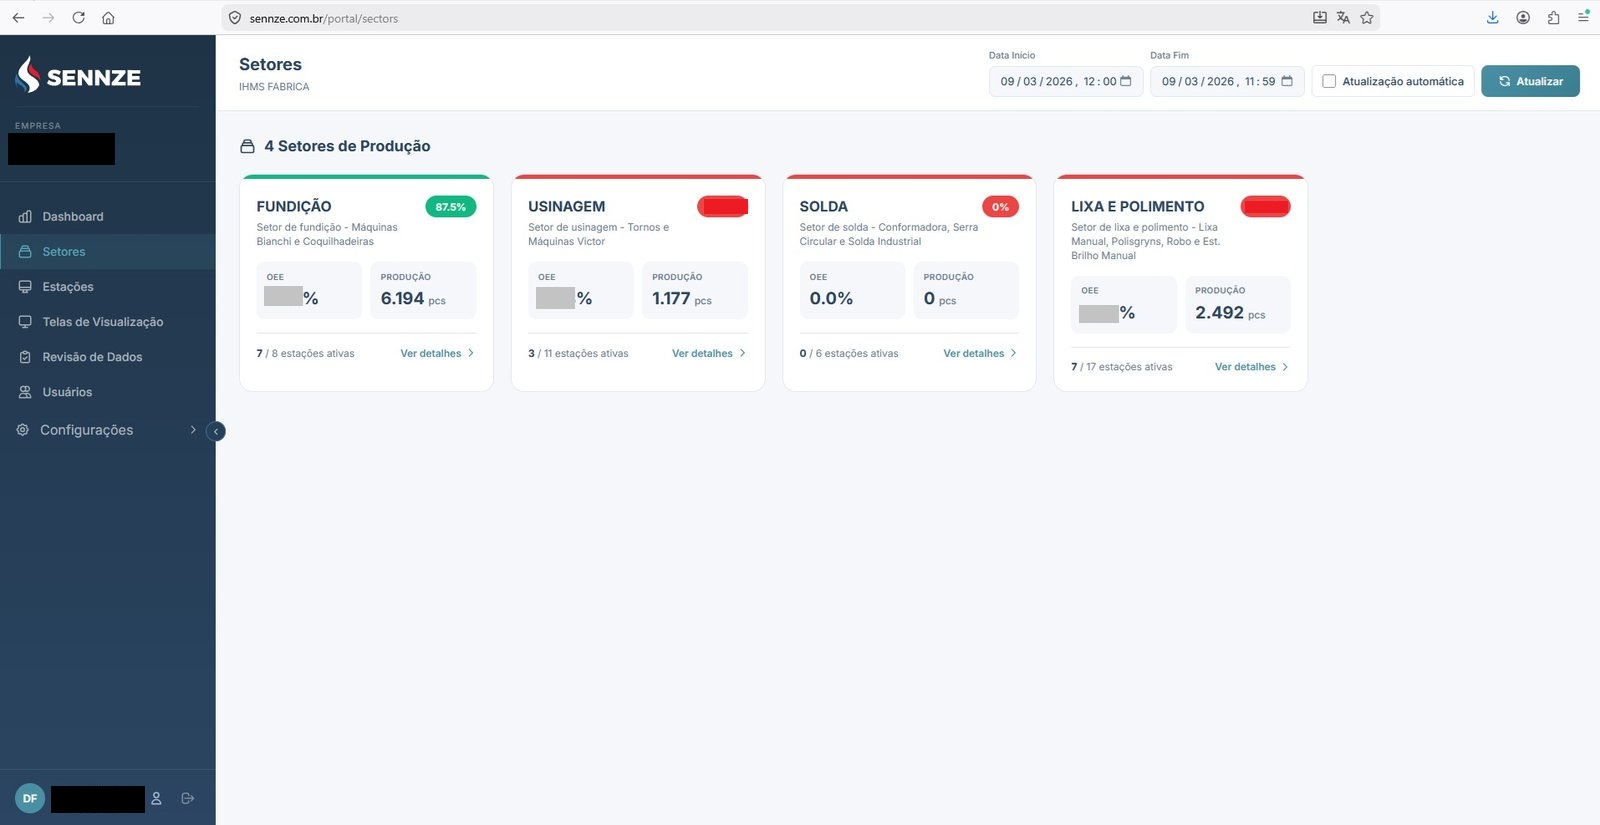
The platform relates output to the station, the product, the operator and the period in which it was produced.
Targets and process parameters make it possible to turn the records into performance indicators and to track how the operation evolves over time.
Quantities produced, good parts and losses associated with the operating period.
Identification of what was being produced and of who was associated with the operation.
Comparison between the output achieved and the parameters defined for each production context.
Operational history
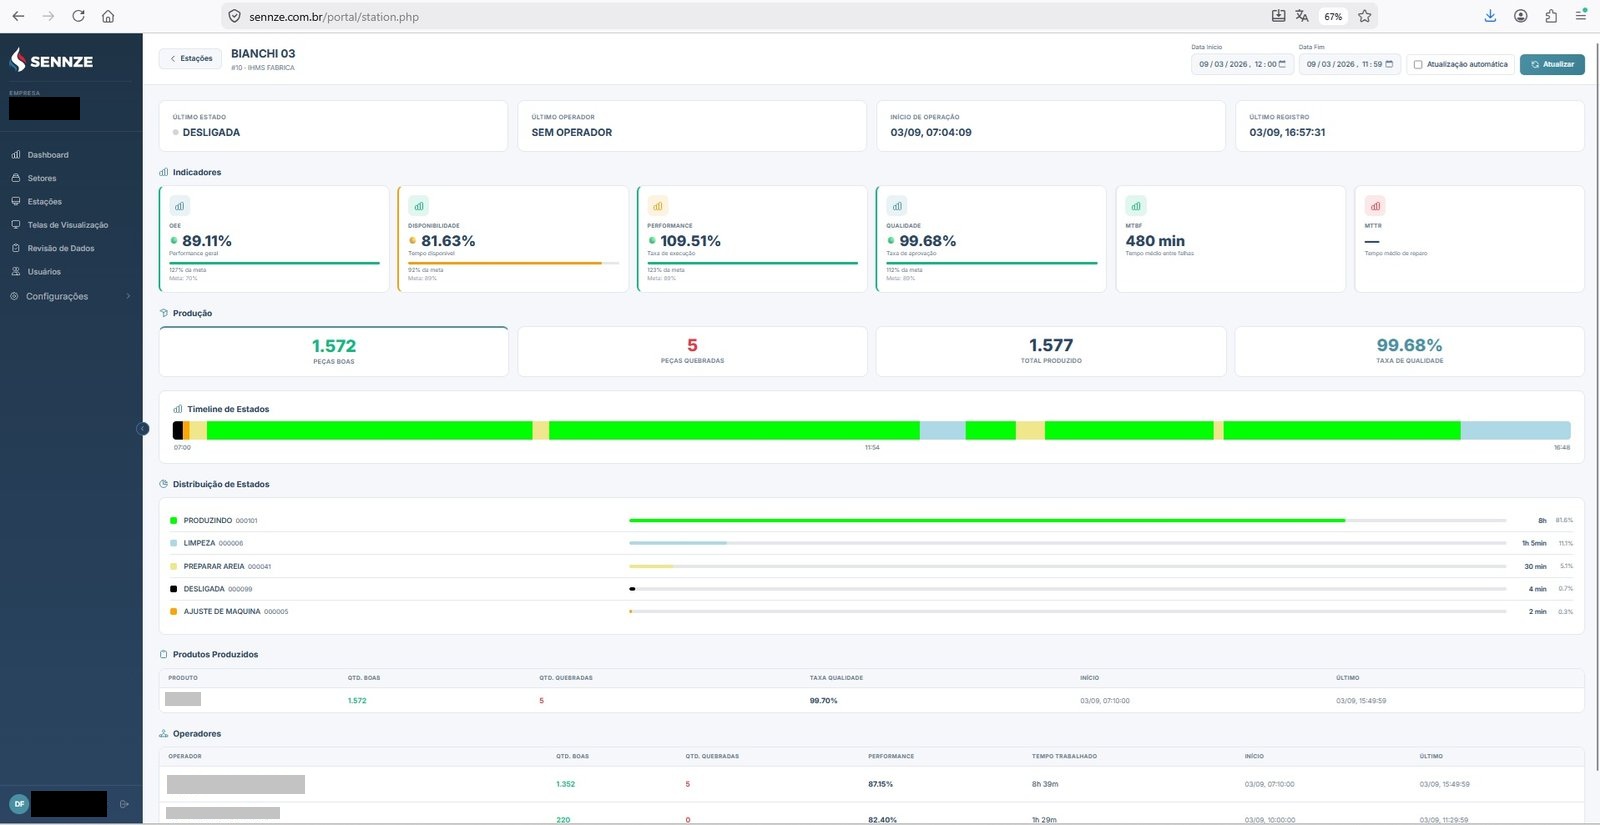
States record the changes that occurred during the operation and make it possible to reconstruct how the station behaved across the period.
Running, stopped, operator absent and other configured states can be shown on a timeline, making it easier to identify unproductive periods and relevant events.
Time record of the state changes.
Duration of each operating condition.
Context of the station during the period analyzed.
Operational performance
The platform uses the operation's own records to calculate performance indicators and make them available at different levels of visualization.
Consolidated view of overall equipment effectiveness.
How much of the planned time was actually available for production.
Relationship between the result achieved and the parameters defined for the operation.
Relationship between total output and output considered conforming.
Beyond output
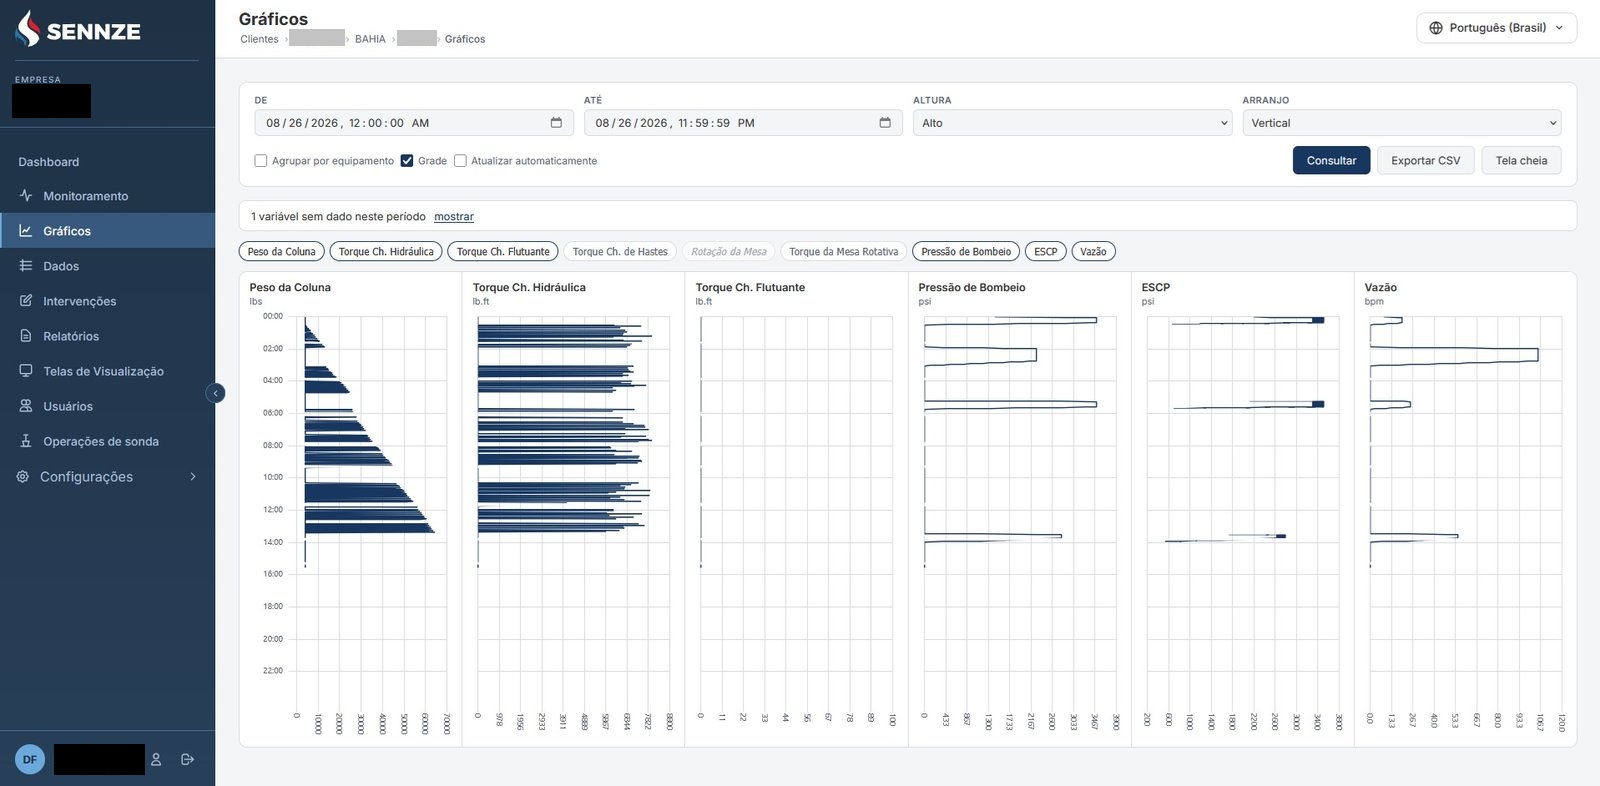
Pressure, level, temperature, rotation and other quantities can be acquired and stored independently of the production records.
The data can be shown in real time, as history and as charts, making it possible to relate the behavior of the variables to the context of the operation.
Follow-up of the current values.
Consultation of how the variables evolved.
Analysis of the values alongside the events of the operation.
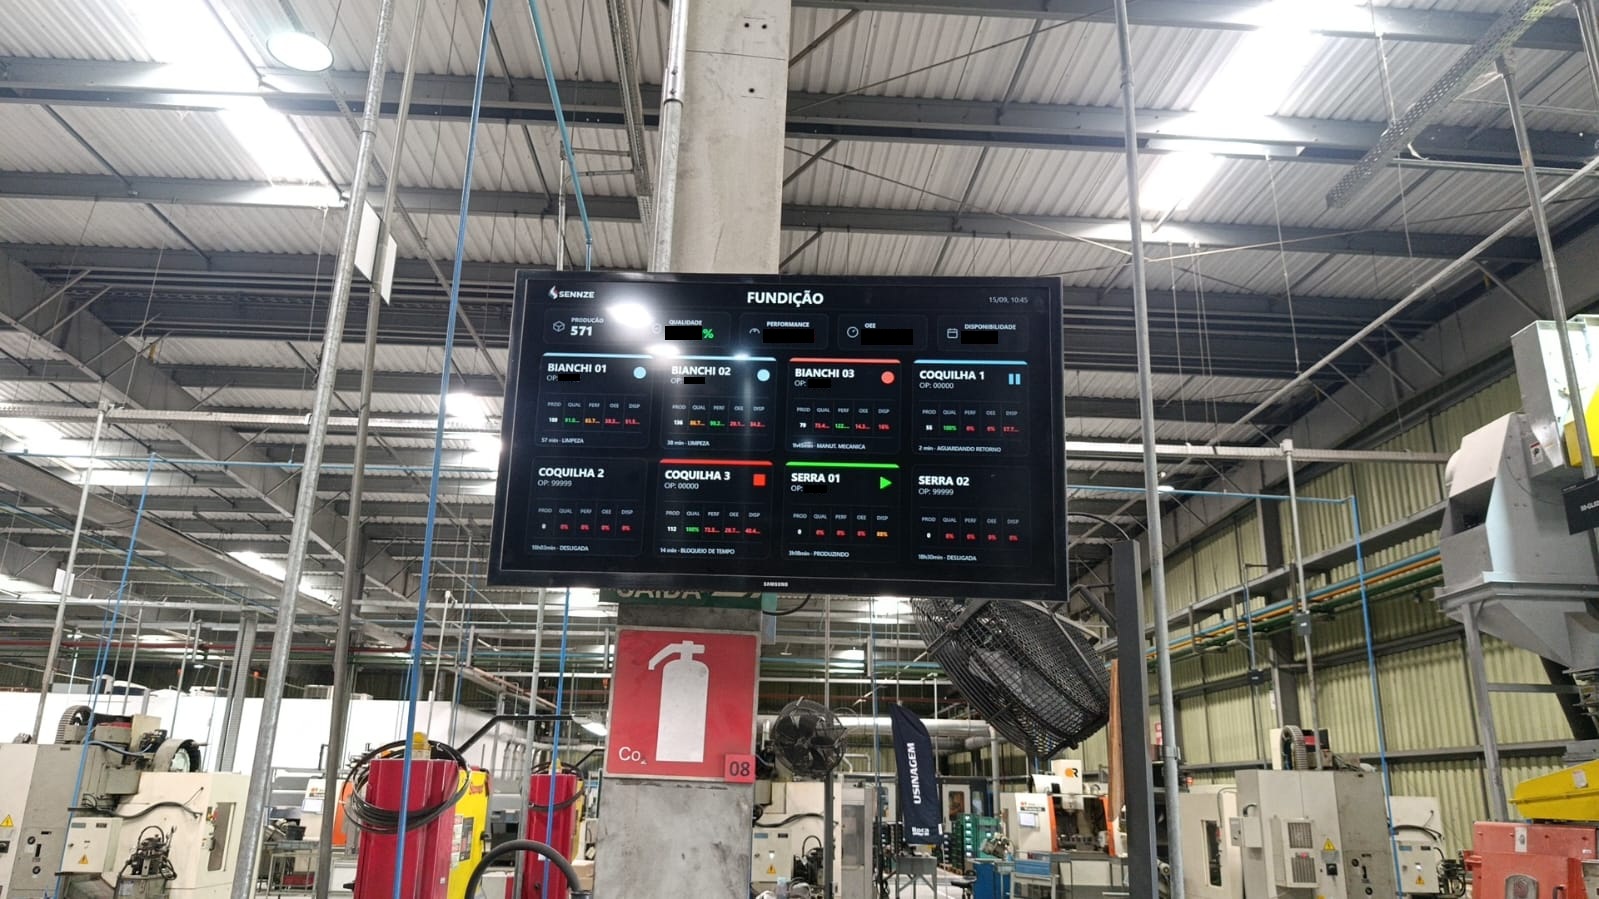
Information where it is needed
The information does not have to stay confined to reports or to a manager's screen.
Dedicated panels can stay on continuous display in the operating areas, showing the indicators relevant to each department and refreshing the information automatically.
A single operational base
Not all relevant information is electronically available on a machine.
The platform can combine automatically acquired data with records entered by the operation, keeping the context of each piece of information. That makes it possible to include instrumented machines, manual stations and processes that depend on human entry in the same structure.
Machines · Sensors · Protocols
Output · States · Operators · Process information
Data before consolidation
Output and state records may need corrections before being used in consolidations or sent to other environments.
The SENNZE architecture allows review and validation processes to be built in before that information moves on to the later stages of use.
Distributed architecture
SENNZE can keep acquisition, processing and storage inside the operation's local infrastructure.
The web platform receives the information needed for remote monitoring, dashboards and management, without turning the internet connection into a requirement for local acquisition to continue.
Different operations
The same architecture can take on different configurations according to the process being monitored.
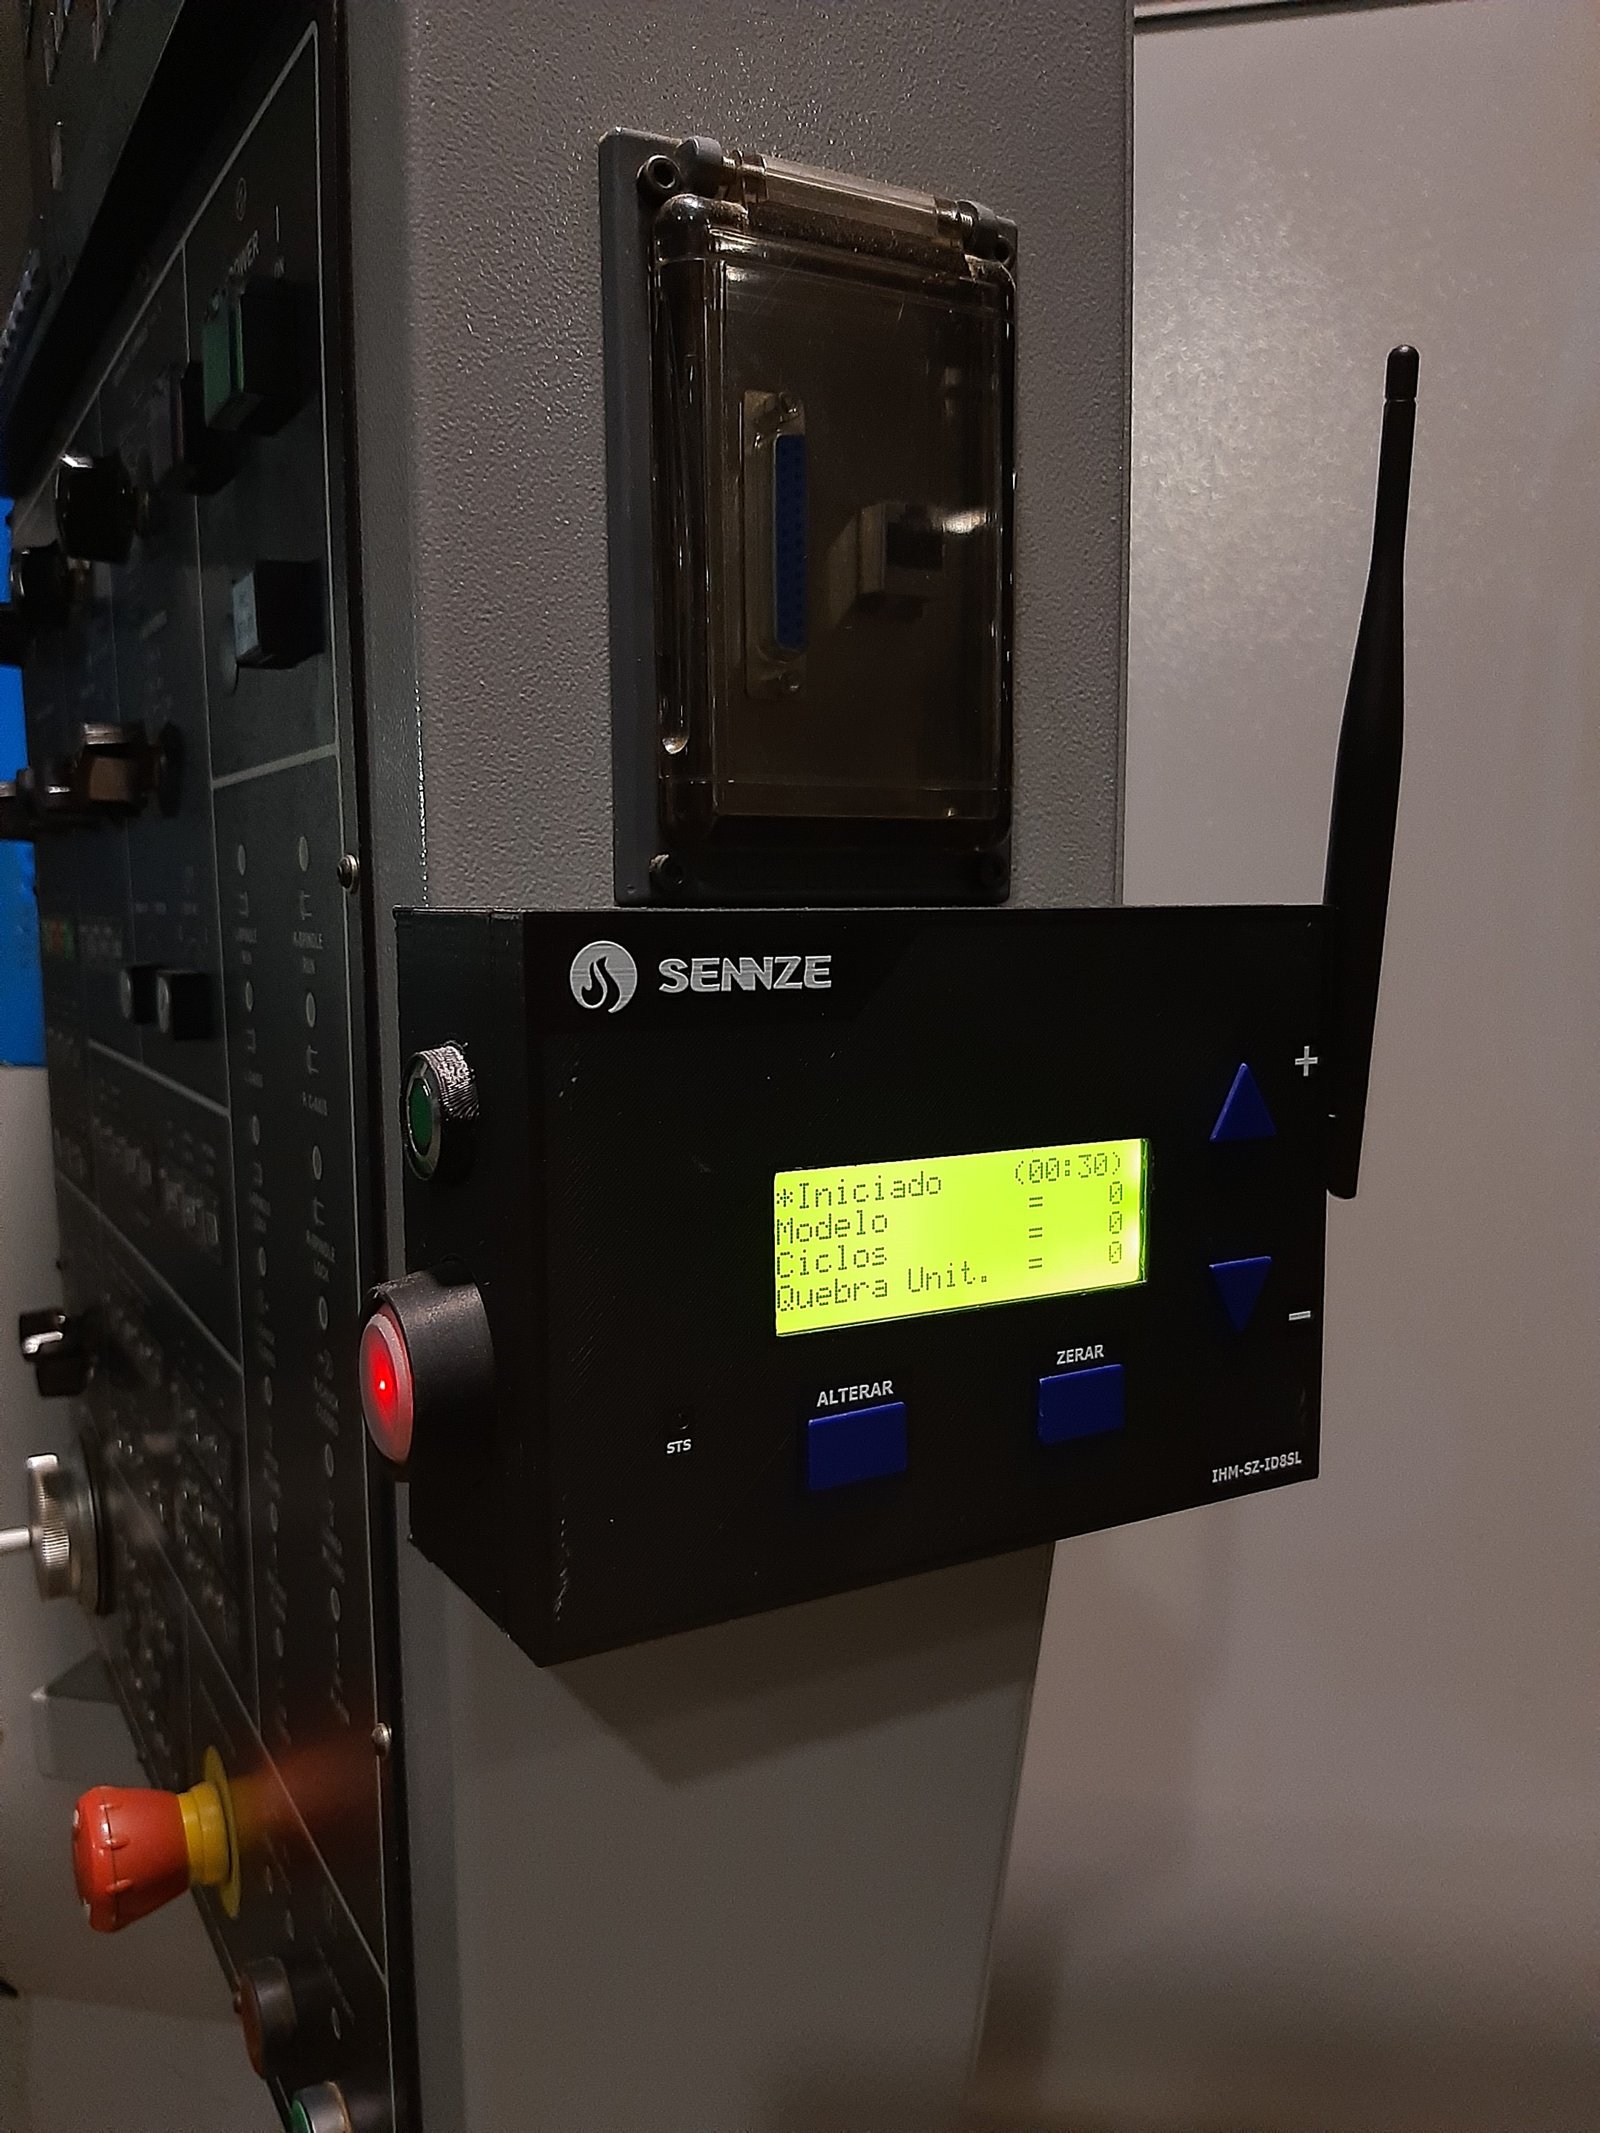
Output, states, operators, quality, OEE and monitoring of machines and operational stations.
SENNZE in Industry →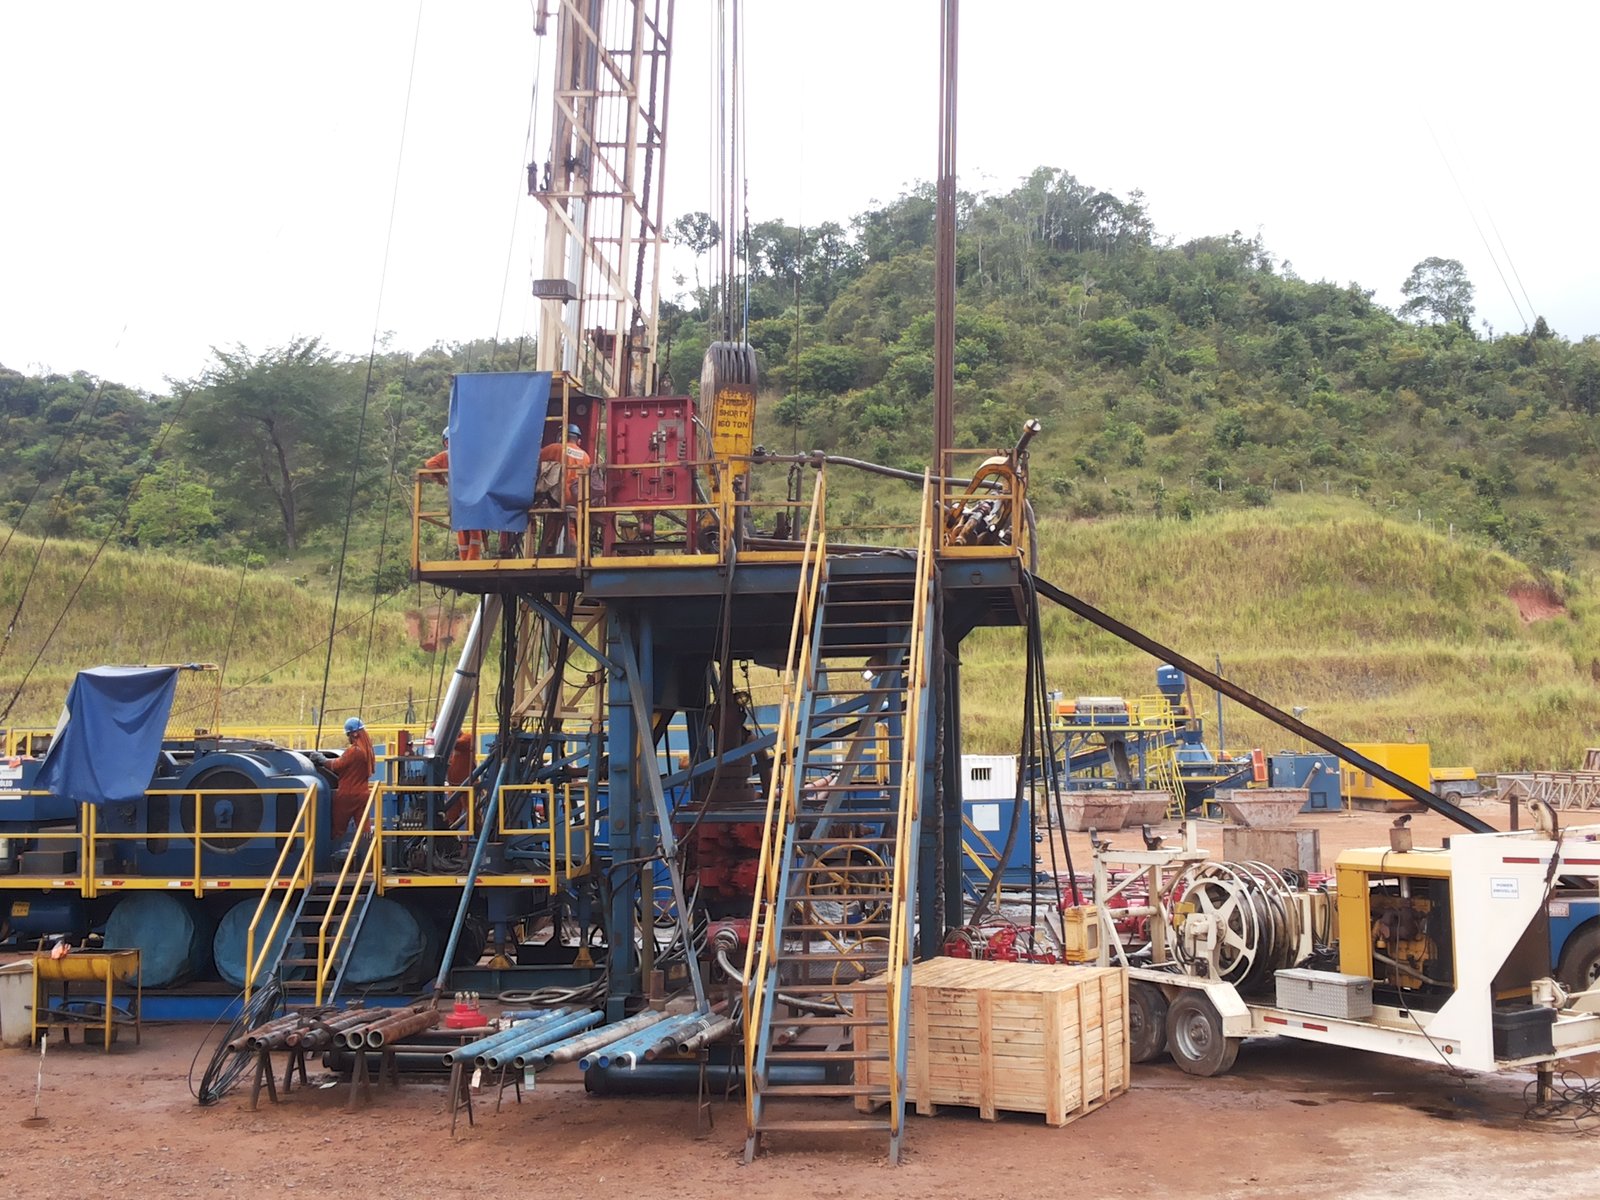
Process variables, operational monitoring, history and local visualization in field operations.
SENNZE in Oil & Gas →Talk to SENNZE
Setting up SENNZE starts from the data available, the characteristics of the process and the information that has to reach the operation and management.