
SENNZE IN OIL & GAS
Field data has to keep existing when the connection does not.
SENNZE started in workover operations in 2014. The architecture was built to acquire, process and record information close to the operation, in environments where continuity and history are part of the job.
See the field application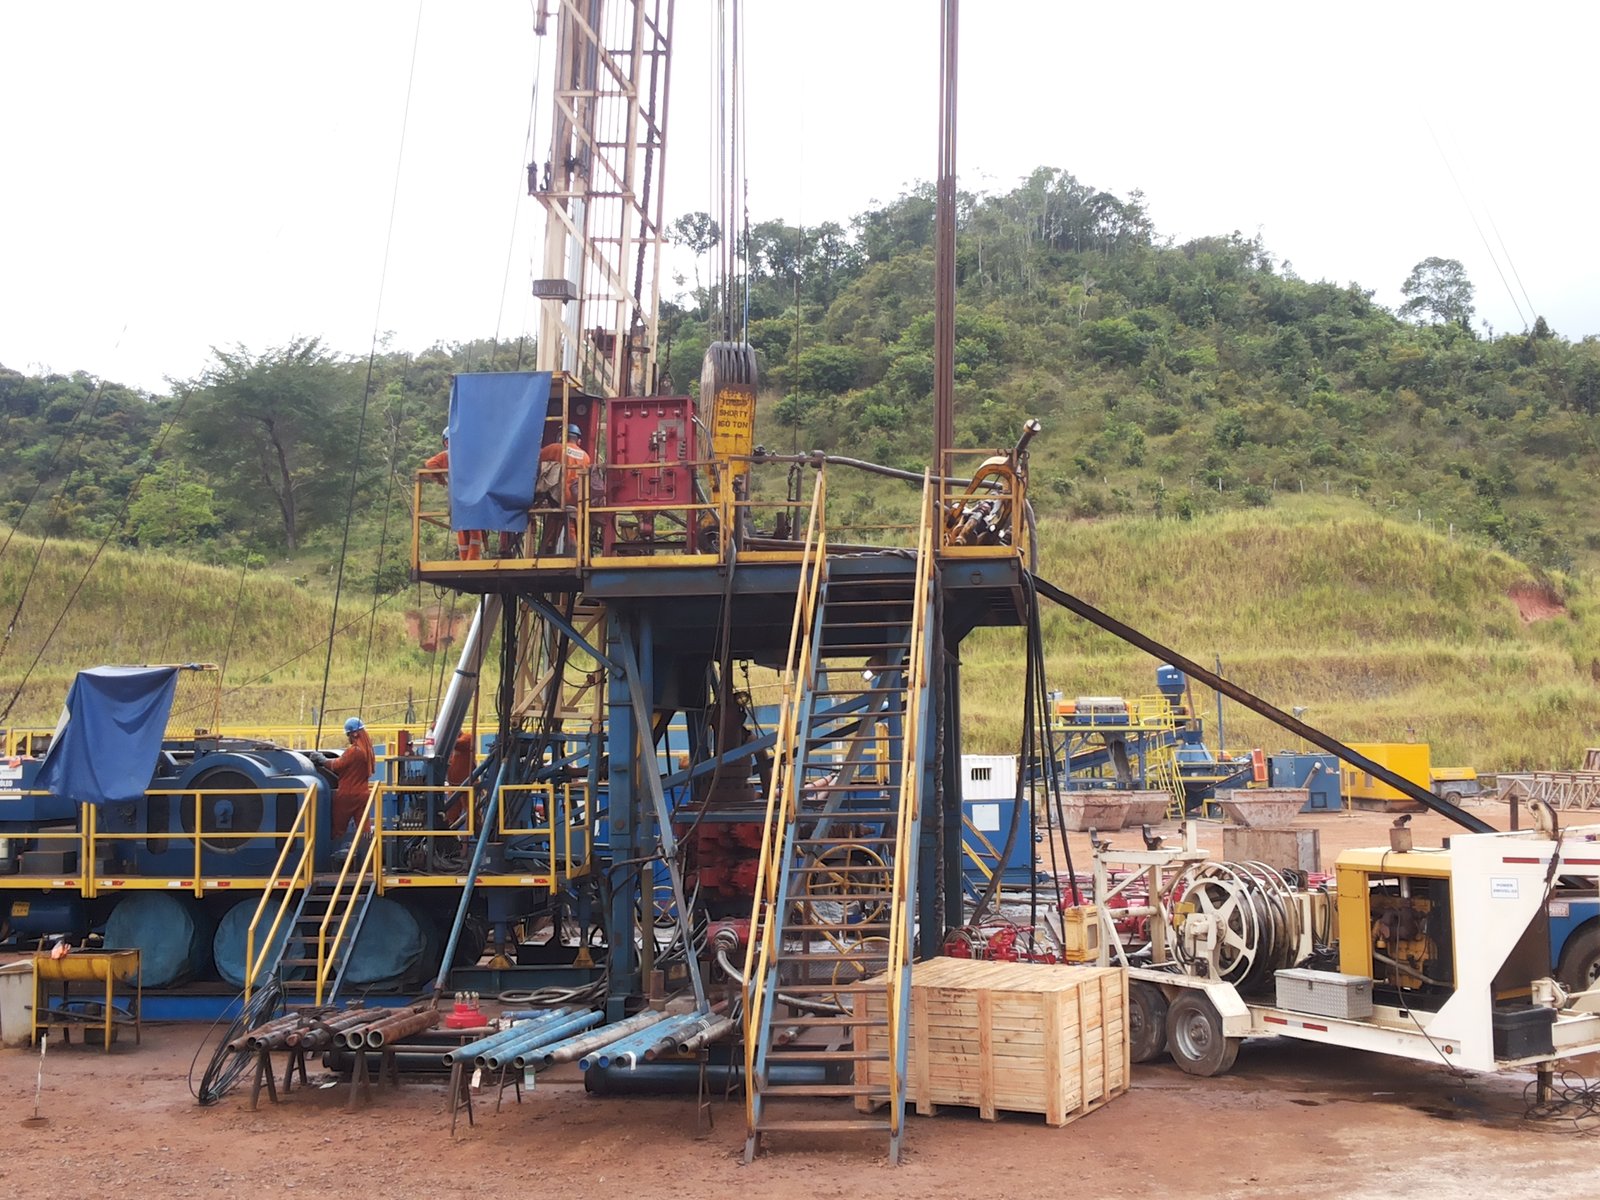
THE FIELD AS THE SOURCE OF THE DATA
The platform starts with the variables that describe the operation
Pressure, level, rotation, displacement and digital signals can represent different parts of one same operation. The first job is to identify which quantities exist, where they can be obtained and what they mean in the process.
From there, SENNZE organizes acquisition, processing and visualization so that the values stop being isolated points and start forming an operational history.
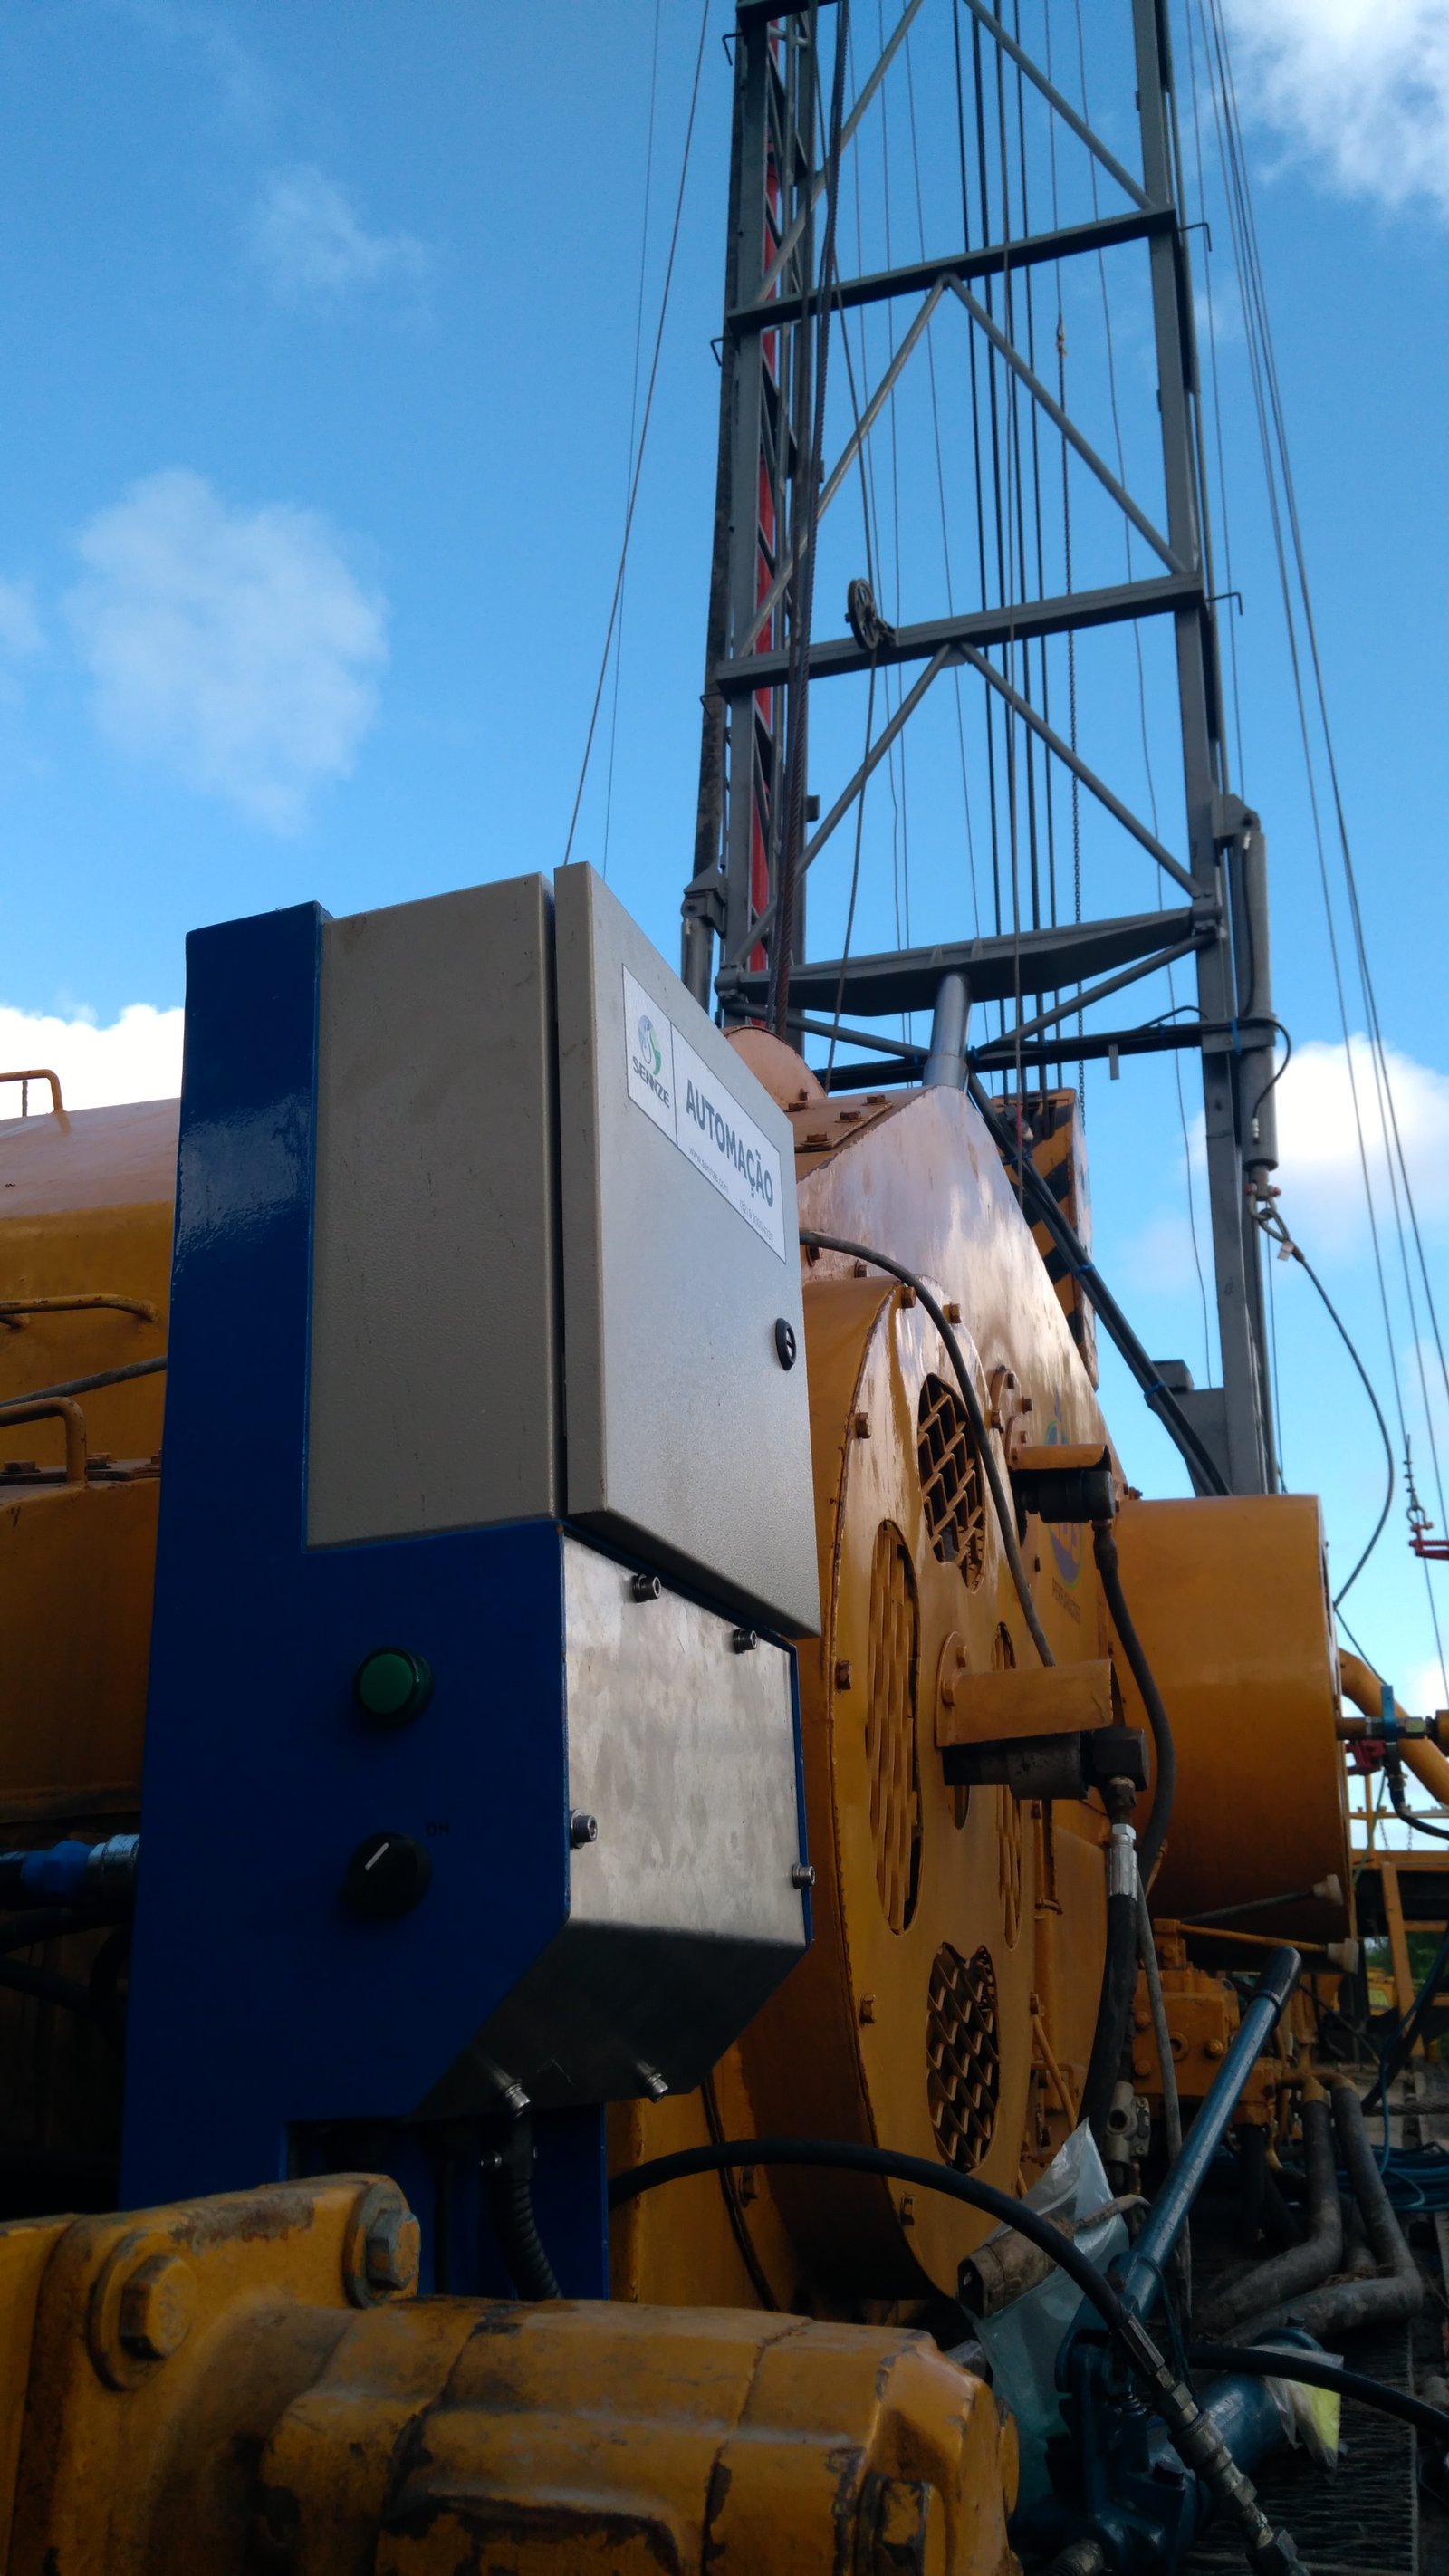
CONTINUOUS FOLLOW-UP
The current value matters. So does how it evolves over time.
Process variables can be recorded independently of the production entries, making it possible to track behavior, changes and periods without information across the operation.
Real time
Display of the current values for operational monitoring.
History
Consultation of how the quantities evolved over the period analyzed.
Context
Values related to the events and periods of the operation.
Visual integrity
A gap in the data stays identifiable, instead of being shown as a valid measurement.
INSTRUMENTATION DEFINED BY THE APPLICATION
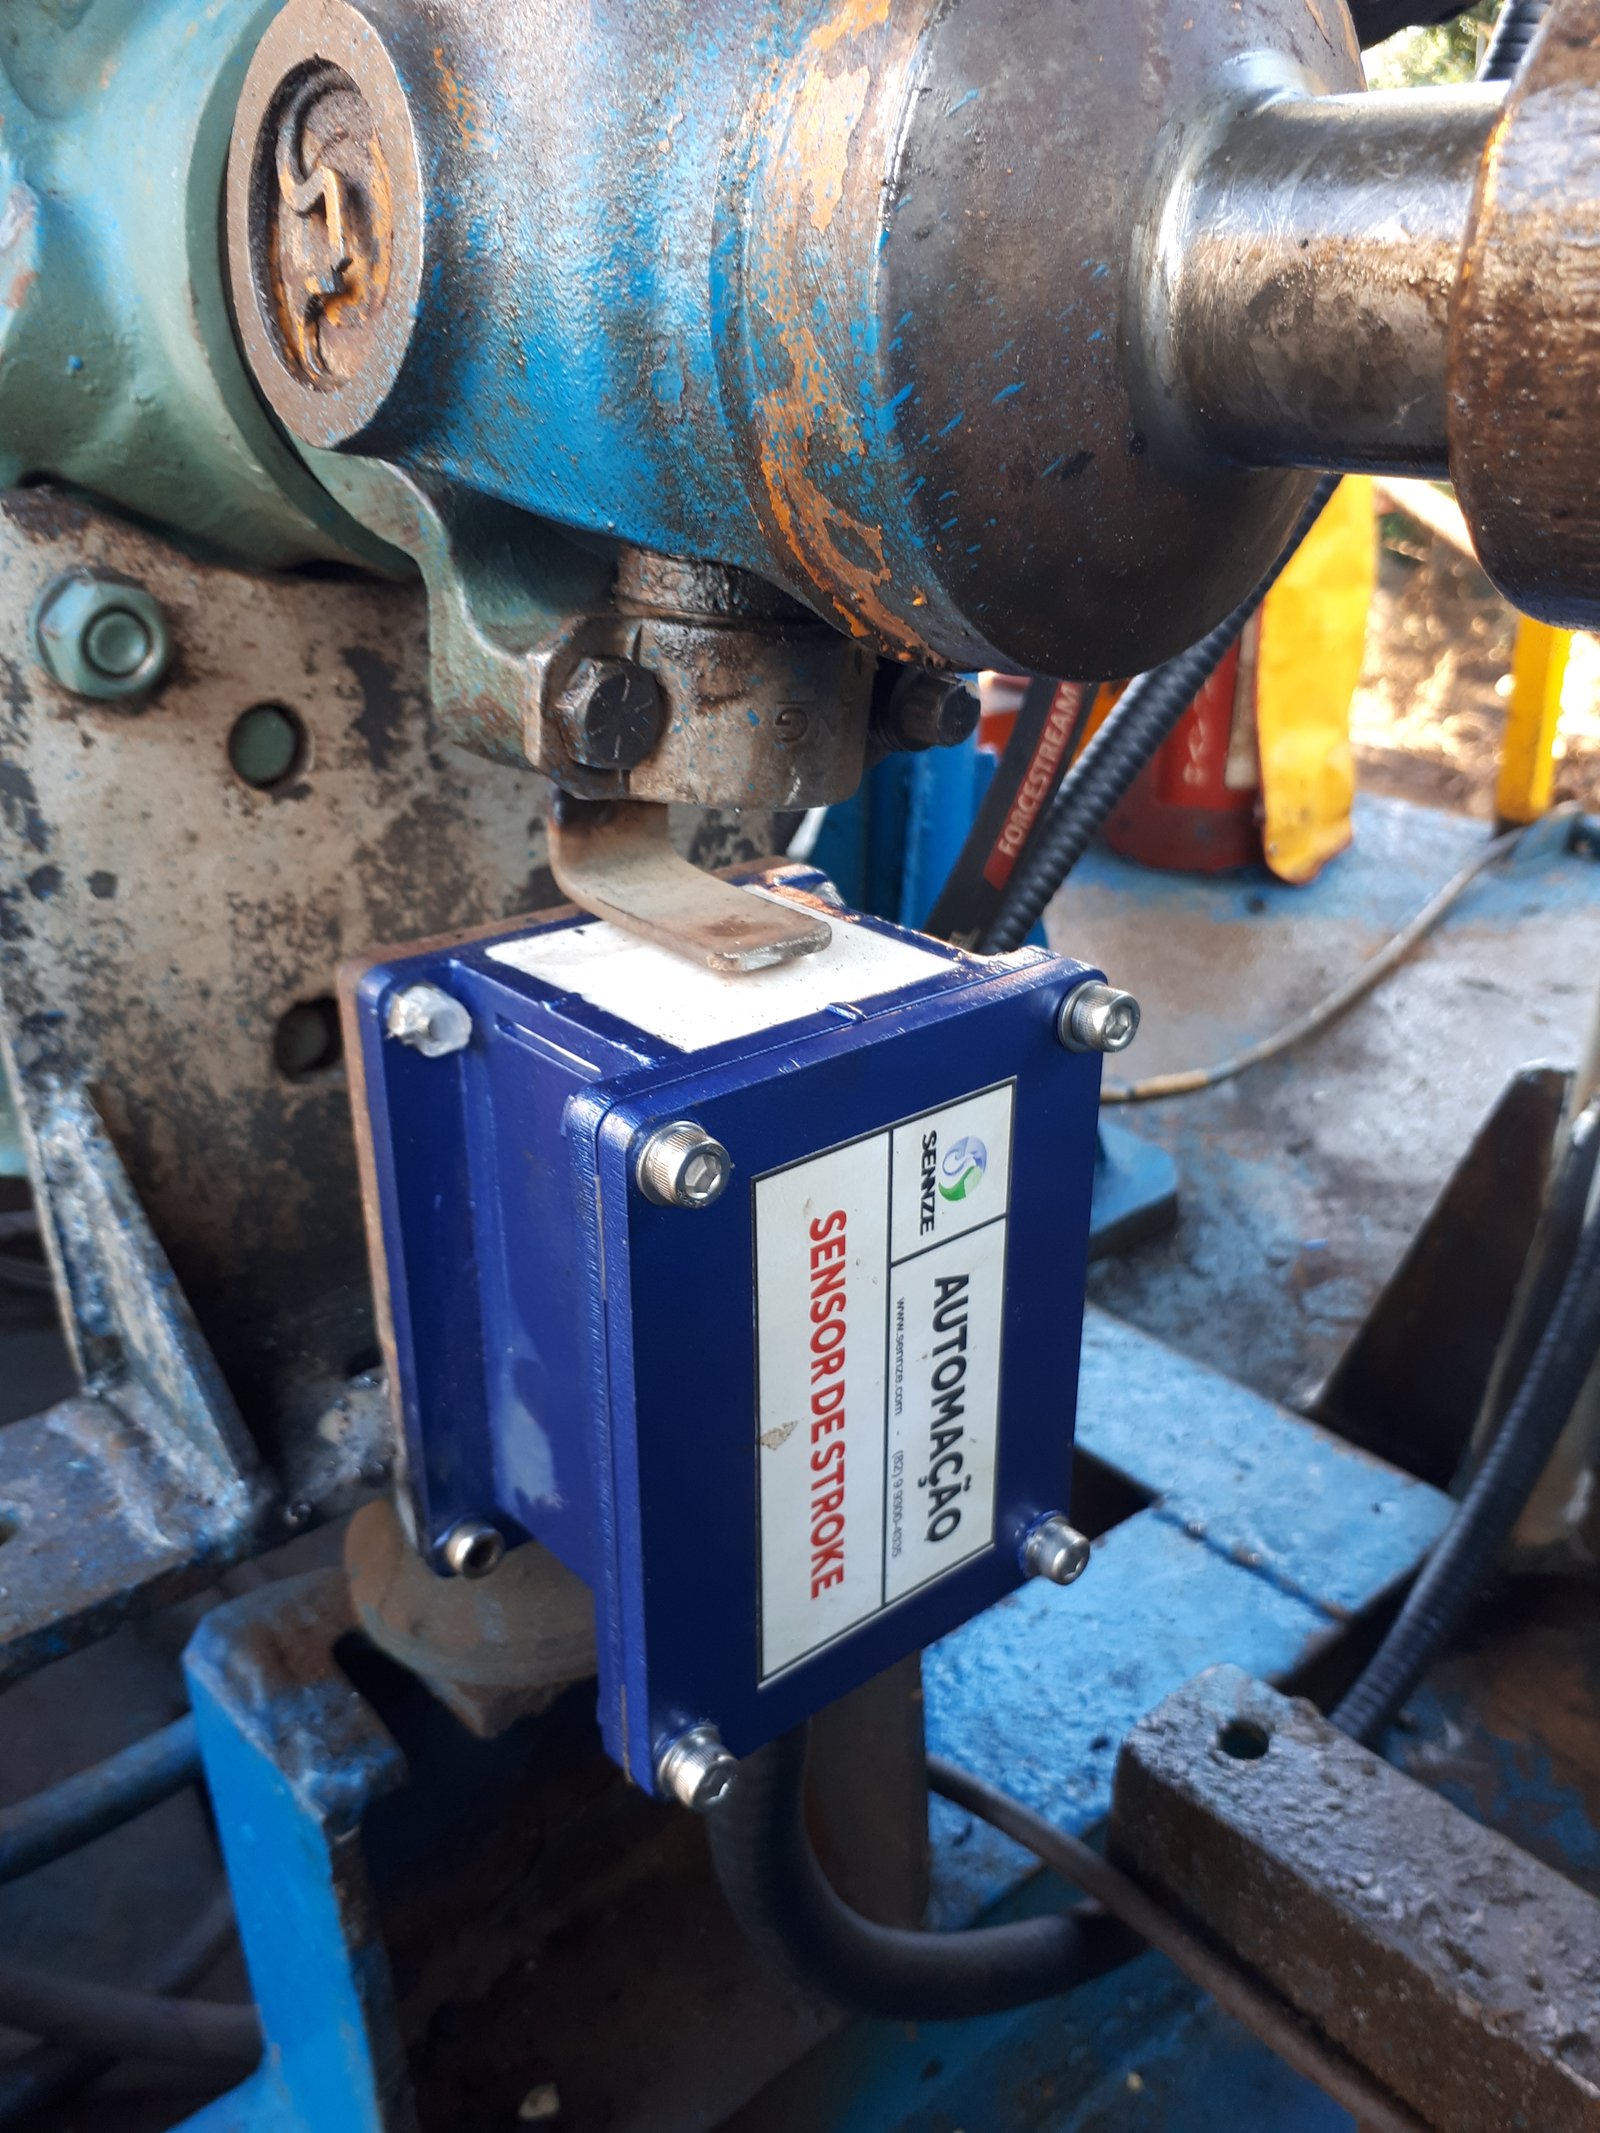
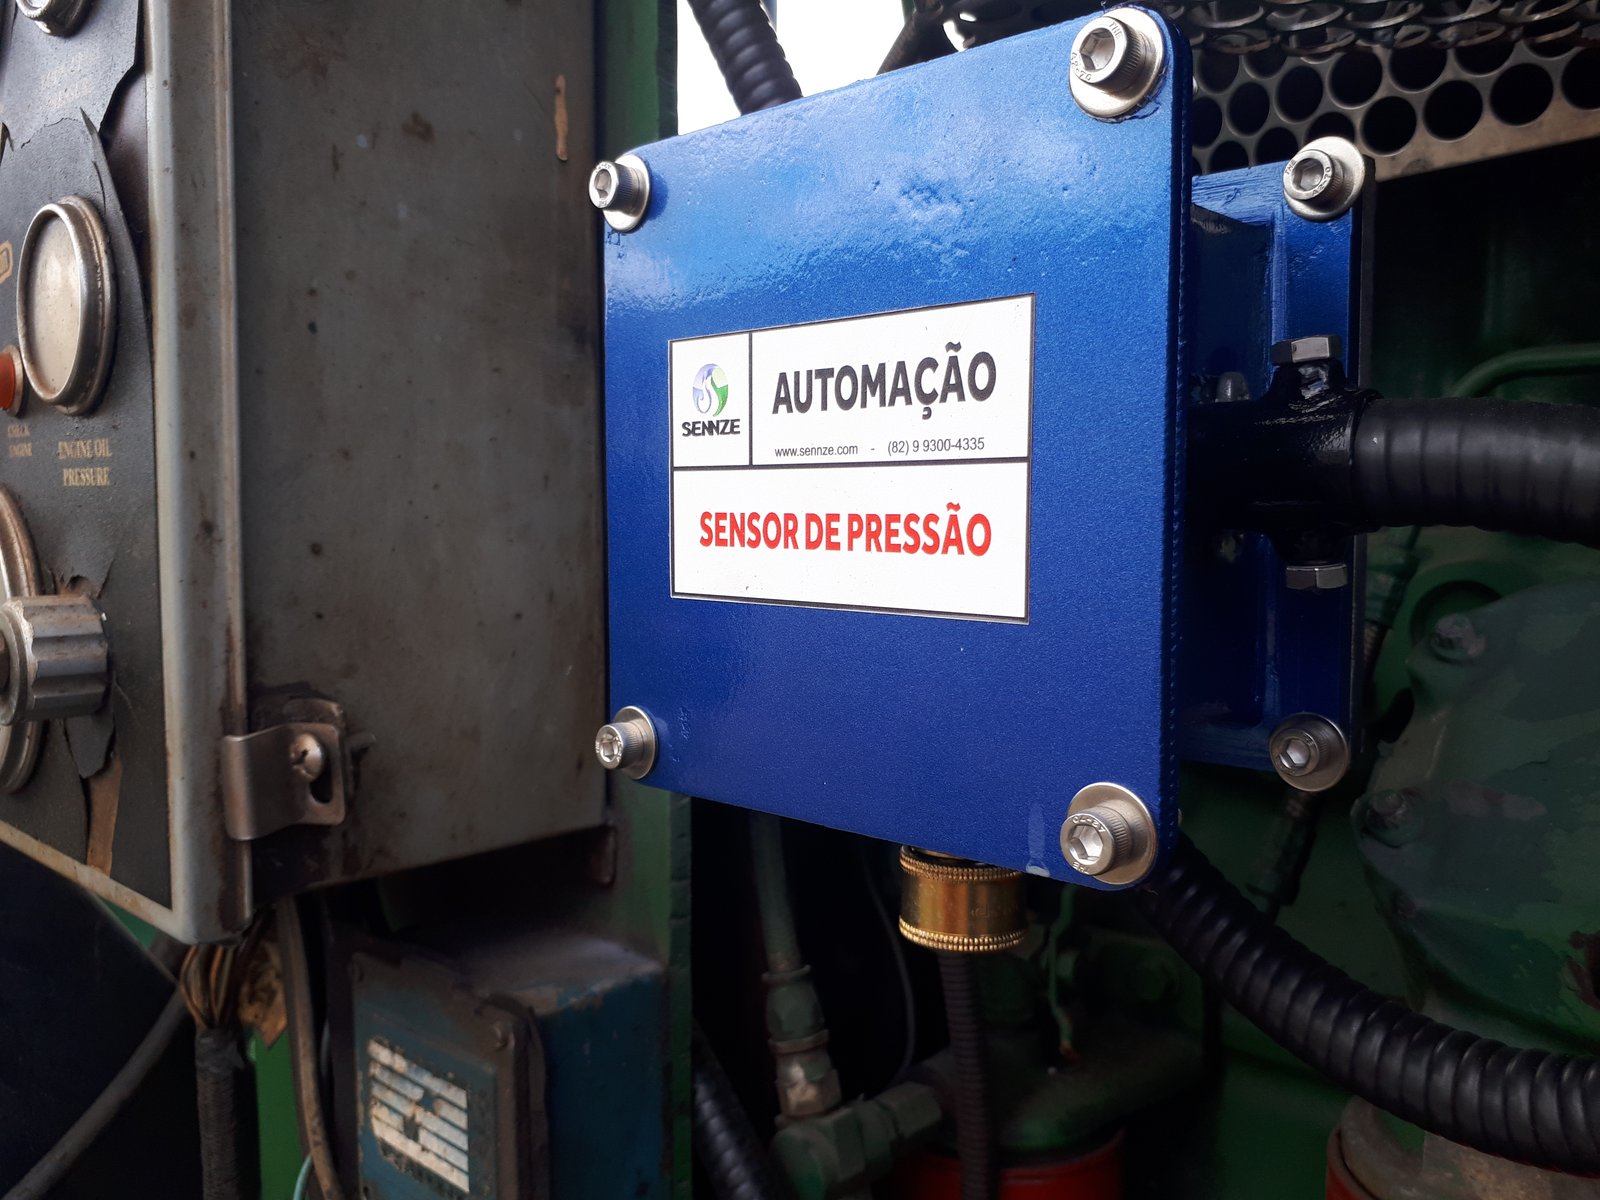
The measuring point has to respect the environment where it will be installed
How a signal is obtained depends on the variable, the existing instrumentation, the infrastructure available and the physical conditions of the installation. Sensors and field devices are defined from that context.
In classified areas, the solution also has to respect the requirements applicable to the location. SENNZE does not present its standard hardware as equipment certified for explosive atmospheres.
Where the application requires installation in a classified area, the architecture and the components have to be assessed specifically against that requirement.
MORE THAN A CURVE ON A CHART
Data gains value when it is related to what was going on
A field operation has its own events, periods, interventions and activities. The platform can organize the variables alongside that context, making it easier to read what happened during the work.
That makes it possible to move beyond reading sensors in isolation and build an operational view in which time, quantities and events can be analyzed together.
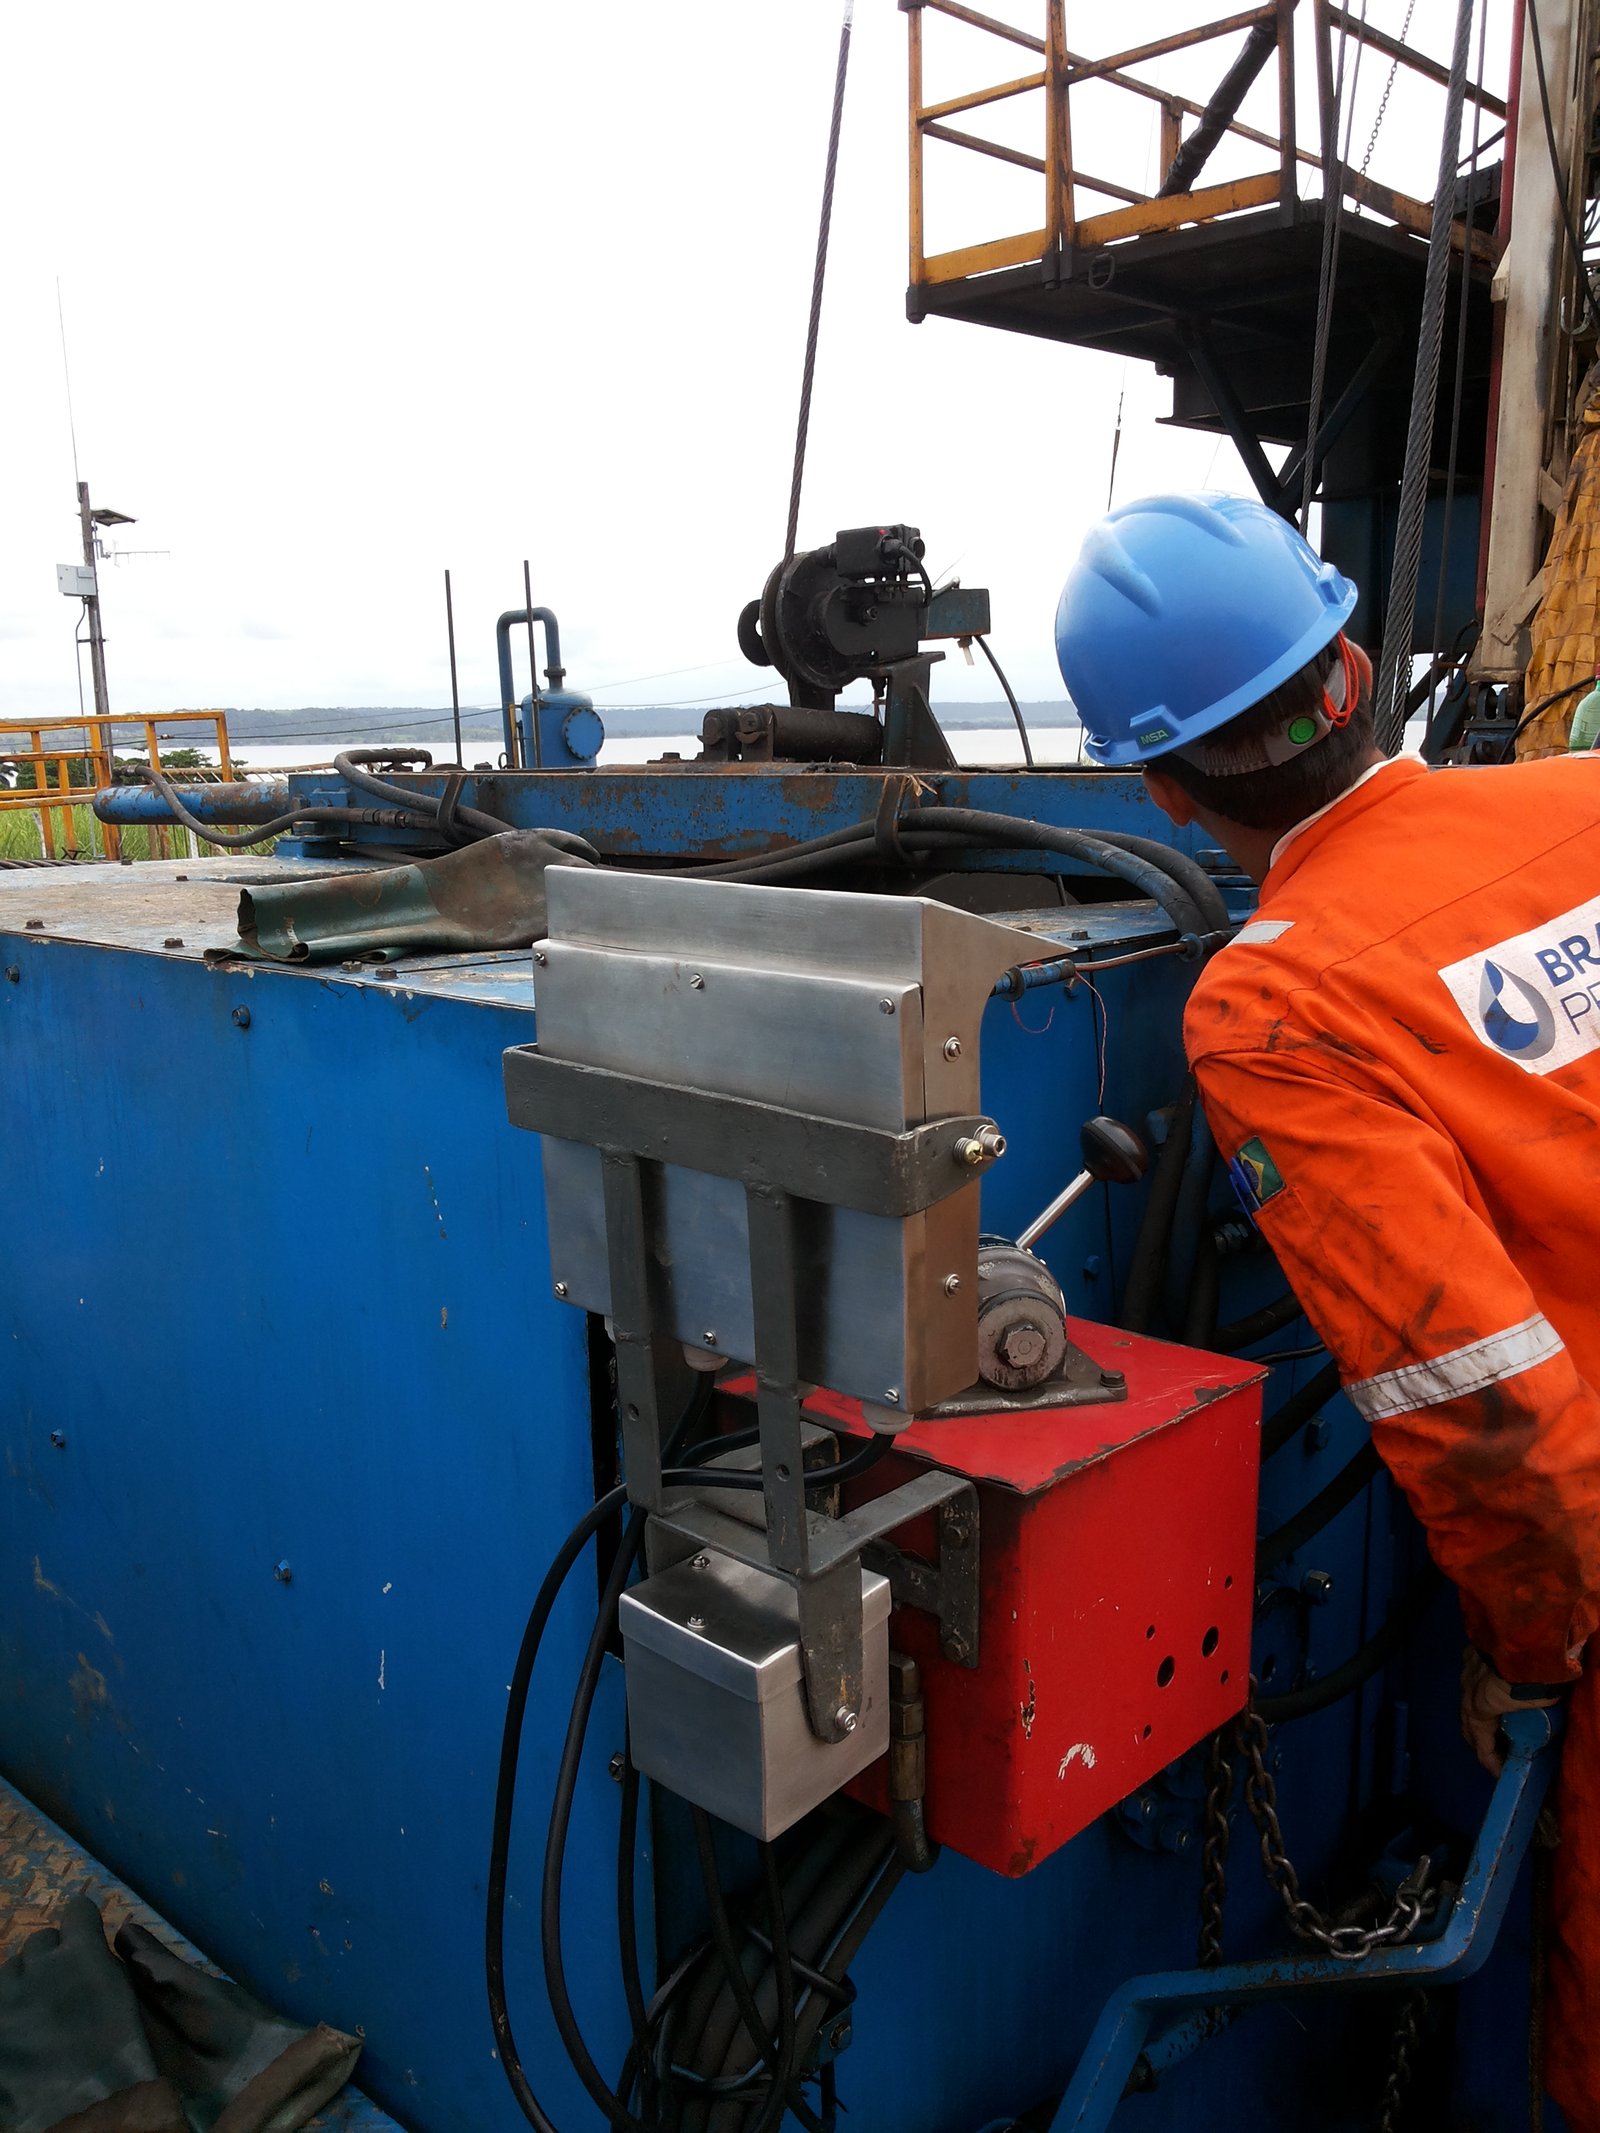
LOCAL VISUALIZATION + HISTORY
From the reading in the field to the analysis of the operation
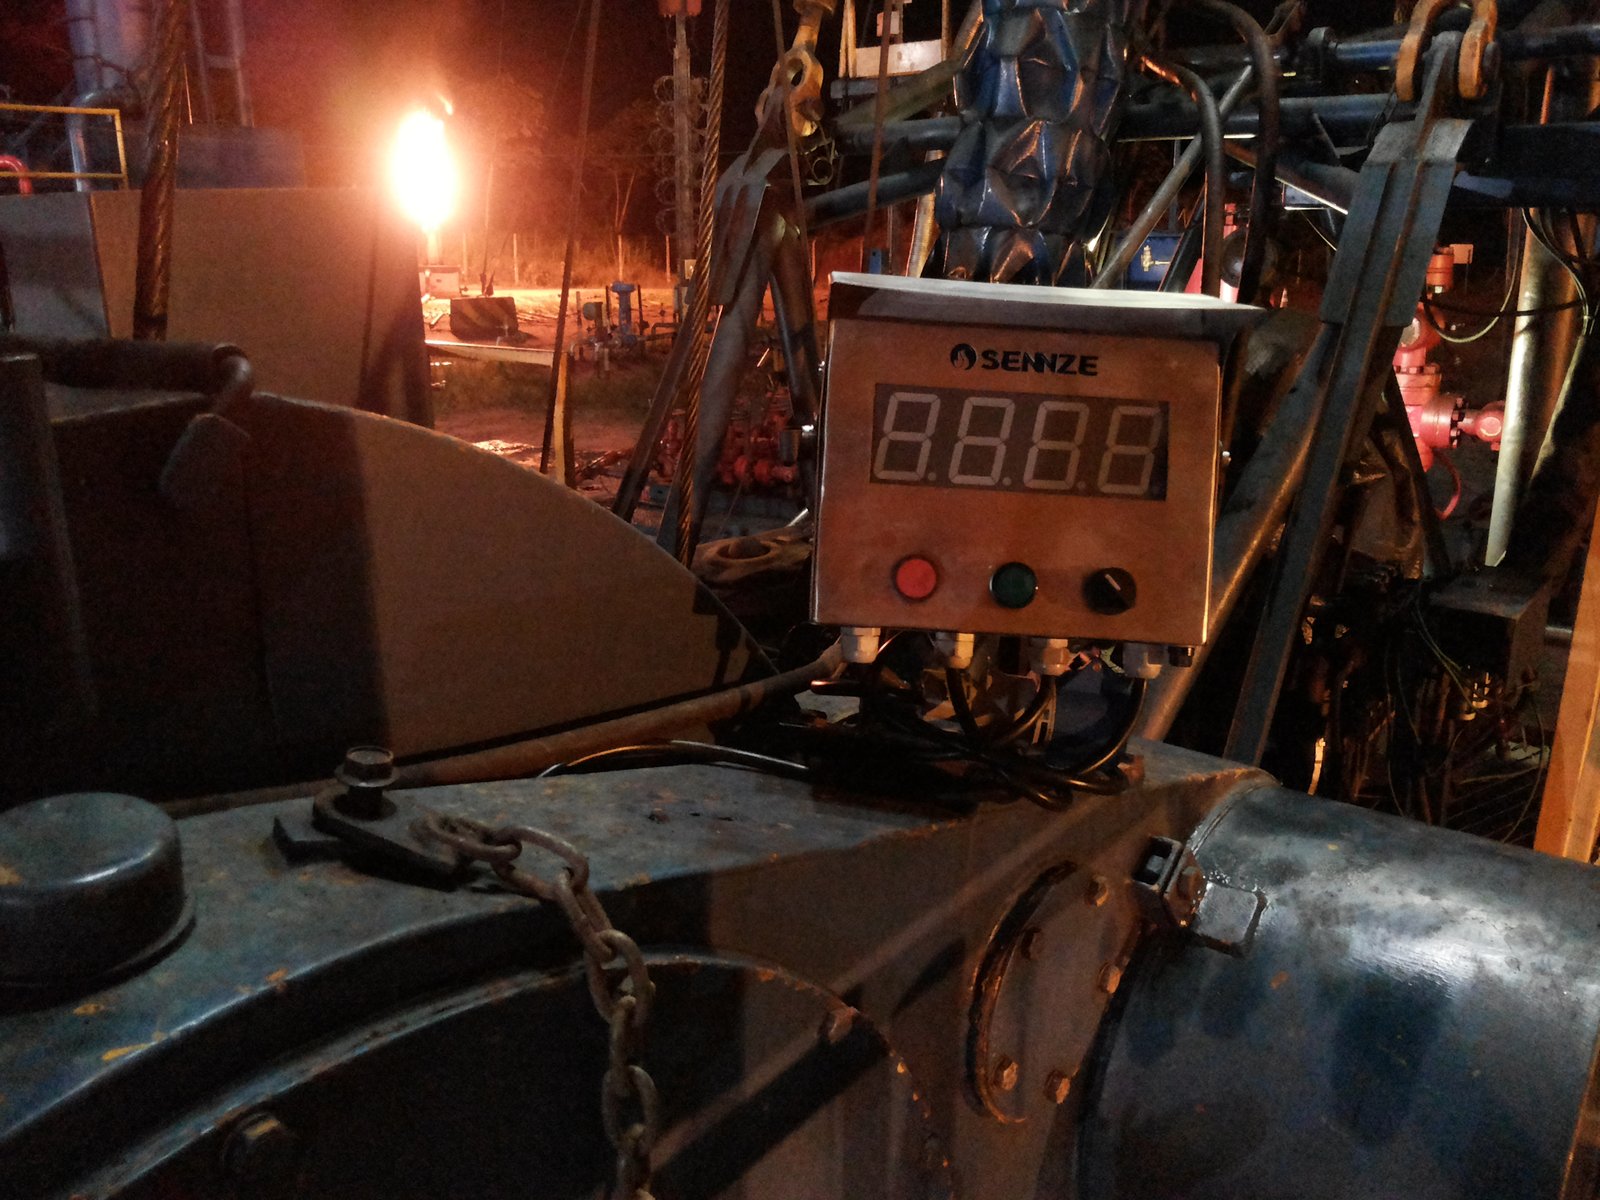
Values can be shown locally for the crew to monitor and also organized into charts and history for later review.
The interface is set up according to the application: the goal is not to reproduce the language of the plant, but to present the information that makes sense for that operation.
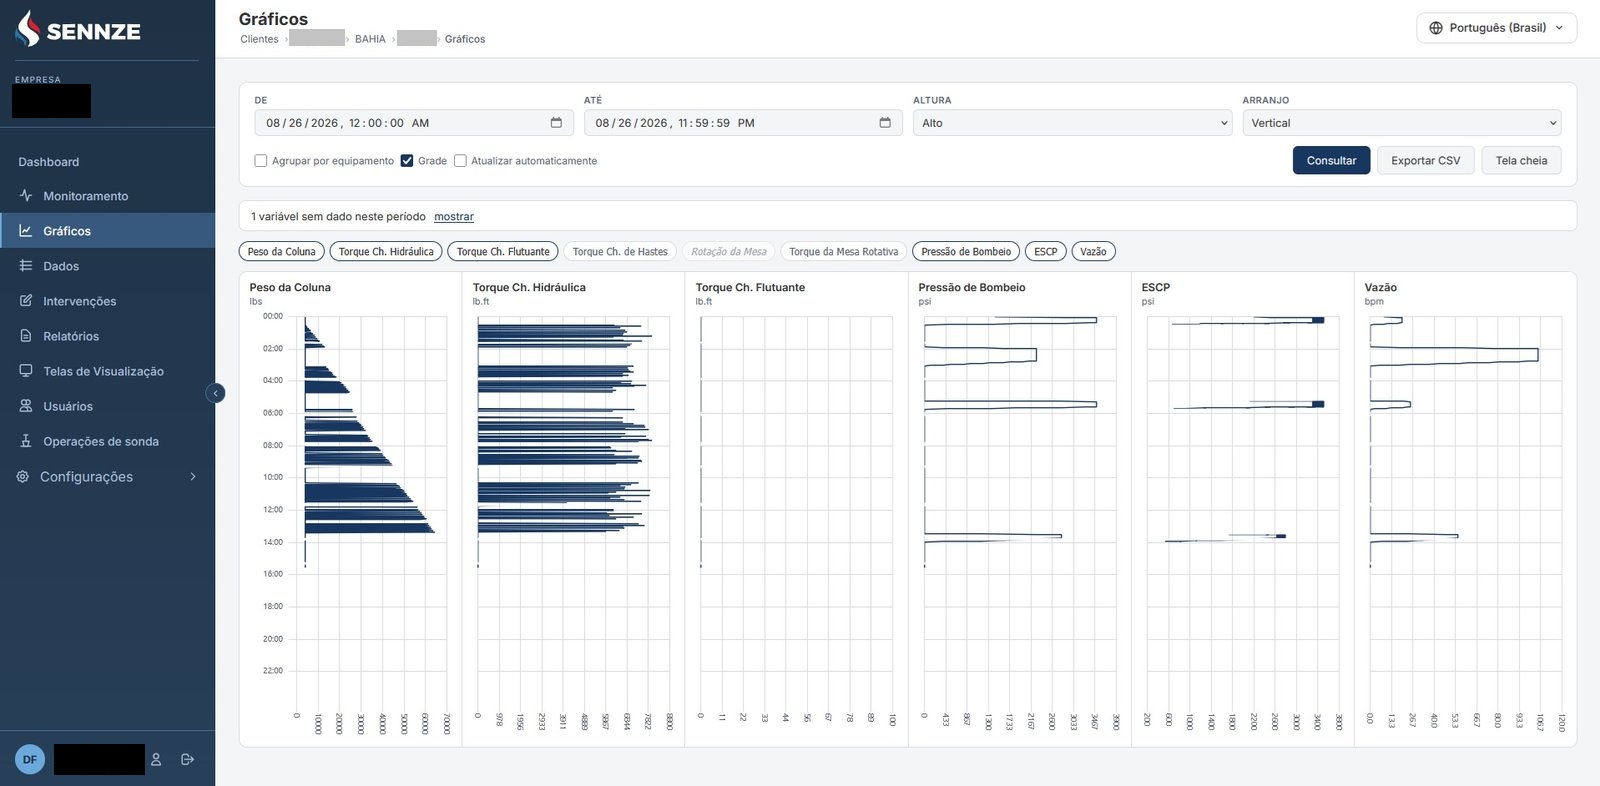
LOCAL + WEB ARCHITECTURE
The internet widens access. It does not have to sustain the acquisition.
The architecture keeps the essential functions close to the operation and uses the web layer to widen visibility, analysis and remote access whenever connectivity is available.
OperationSensors · signals · events
SENNZE acquisitionAcquisition of the variables
Local environmentProcessing and storage
SynchronizationWhenever there is connectivity
Web platformHistory · charts · management
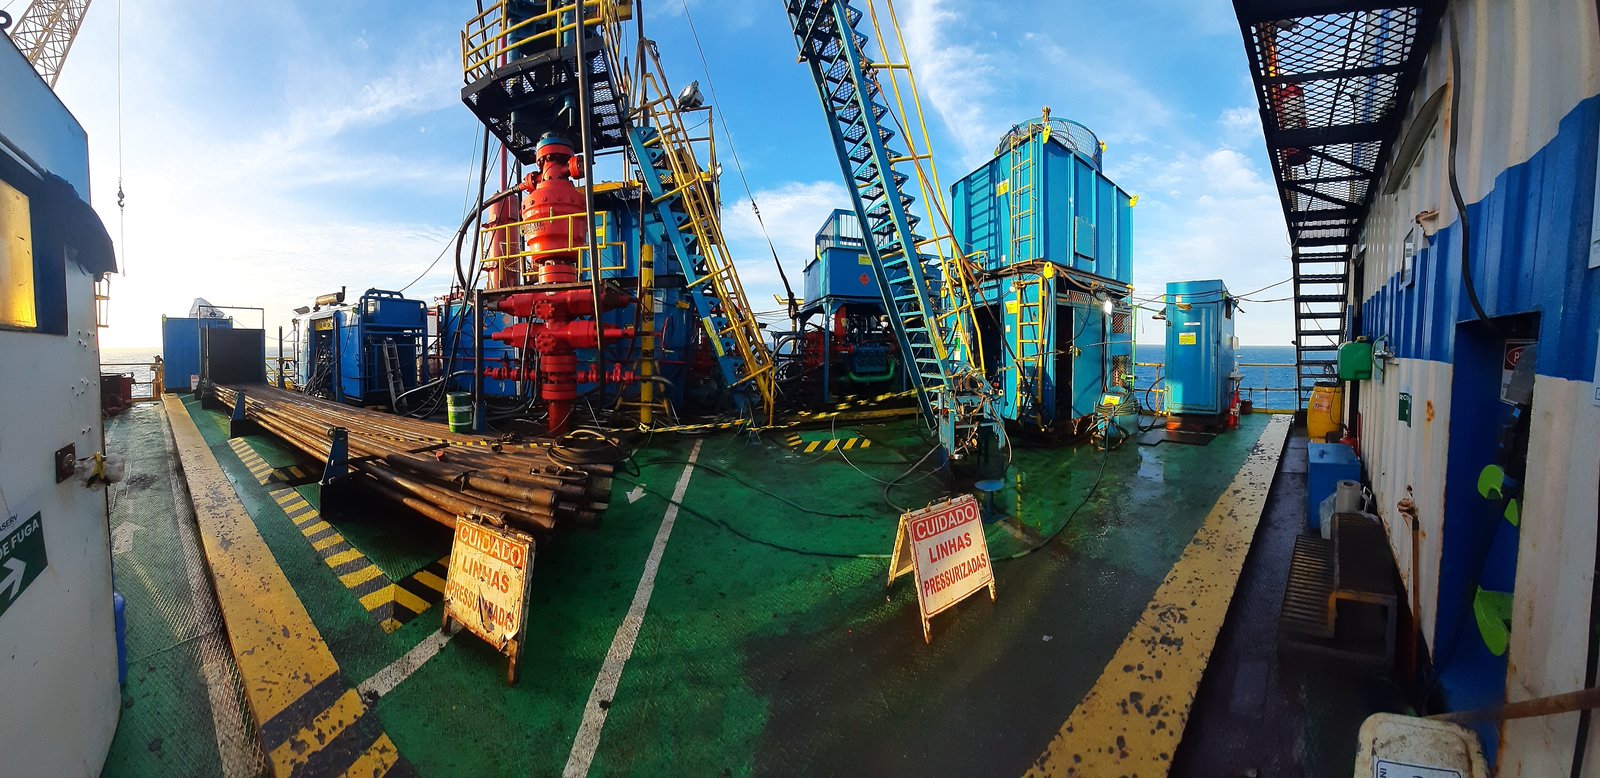
ENGINEERING BEFORE THE PROMISE
Not every field installation is the same — and the solution should not pretend otherwise
Distance, power supply, type of signal, connectivity, positioning of the devices and area classification can change the appropriate solution completely.
That is why the application is defined from the real conditions of the site and the data that needs to be monitored, without treating a field architecture as a universal package.
See field applications →SENNZE IN YOUR OPERATION
We start with the variables, the environment and what needs to be monitored
Show us the operation, the existing instrumentation and the information needed. From there we assess how to acquire, process and present the data in a way that suits the context.
Talk to SENNZE